Copyright © 2025 LOOP All Rights Reserved.
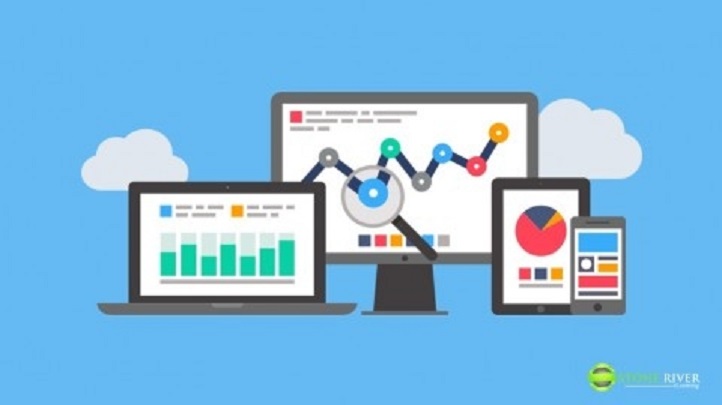
Data Visualization with Python and Matplotlib


Course Description
More and more people are realising the vast benefits and uses of analysing big data. However, the majority of people lack the skills and the time needed to understand this data in its original form. That's where data visualisation comes in; creating easy to read, simple to understand graphs, charts and other visual representations of data. Python 3 and Matplotlib are the most easily accessible and efficient to use programs to do just this.
Python Data Visualisation made easy.
- Visualise multiple forms of 2D and 3D graphs; line graphs, scatter plots, bar charts, etc.
- Load and organise data from various sources for visualisation
- Create and customise live graphs
- Add finesse and style to make your graphs visually appealing
Course Objectives
1. Understanding Matplotlib and getting set up
2. Learning the different types of basic Matplotlib charts
3. Mastering the basic customization options for Matplotlib
4. Customizing ticks, add/remove & customize spines, styles with Matplotlib
Related Courses
Become a Professional Web Developer Bundle: JavaScript,Angular and Jquery
SGD $79.00
Course Description
Learn to use the most popular programming languages, JavaScript, grasp the basic concepts of AngularJS and its main features and learn to make website creation, responsive and accessible apps easily with jQuery with this extensive course. Put your lessons in practical uses with functional examples. Most courses on web development walk you through the skills beginners need, but then require you to learn the skills that make you an employable web developer. This course is different. After you have learned the basics and built real projects for your portfolio, you can move on to hours and hours of continued training at the intermediate and advanced levels for each web development skill you've learned.Challenge yourself and become a Professional Web Developer.- Pick up a new programming language and be fluent in coding - Learn how each language uses its code to program applications - Know how to apply each language into your own projects- Find out how each language compliments each other when developing a website
Read more...
Learn Python Django From Scratch
SGD $79.00
Course Description
Django is the framework used by some of the biggest websites in the world including Instagram, Pinterest, The Washington Times, Mozilla, and the Public Broadcasting Service. Complex database -driven websites like these need a web application framework – and that's exactly what Django does. Master Python Django and you can create web application, sites with e-commerce functionality, and much much more.This course was created with intermediate Python users in mind, who want to move their expertise onto the web. If you're a beginner developer, you may find this course a little too far beyond your grasp unless you already have experience with another language, or have a working knowledge of Python and programming concepts.Open a World of Possibilities with Django for Web- Create a website from scratch using Django- Learn Django from beginner through to fully functional levels- Build authentication systems, map integration, web services and more- Create web applications to solve a multitude of problems and needs
Read more...
1st Step to Working with Big Data Using Python
SGD $50.00
Course Description
Python programmers are some of the most sought-after employees in the tech world, and Python itself is fast becoming one of the most popular programming languages. One of the best applications of Python however is data analysis; which also happens to be something that employers can't get enough of. Gaining skills in one or the other is a guaranteed way to boost your employability – but put the two together and you'll be unstoppable! More and more people are realizing the vast benefits and uses of analyzing big data. However, the majority of people lack the skills and the time needed to understand this data in its original form. That's where data visualization comes in; creating easy to read, simple to understand graphs, charts and other visual representations of data. Python 3 and Matplotlib are the most easily accessible and efficient to use programs to do just this. Become an expert data analyst with Python made simple - Learn efficient python data analysis and python data mining - Manipulate data sets quickly and easily - Gain a skillset in Python that can be used for various other applications - Visualize multiple forms of 2D and 3D graphs; line graphs, scatter plots, bar charts, etc.
Read more...
Content
Course Introduction
Different types of basic Matplotlib charts
Preview Available
Basic Customization Options
Preview Available
Advanced Customization Options
Geographical Plotting with Basemap
3D graphing
Course Conclusion
Data Visualization with Python and Matplotlib
- Duration 7 hr 4 mins
- Skill level All Levels
- Languages English
- Tag(s) Programming Language Development
Convince your boss email
This site is best viewed using the latest versions of Google Chrome, Apple Safari, Mozilla FireFox, Microsoft Internet Explorer 11 and Edge which supports HTML5/Webkit technologies.